The institution is the lengthened shadow of one man - Emerson
5 stories
·
0 followers

Tesla and Adobe: Why Continuous Deployment May Mean Continuous Customer Disappointment

2 Shares

For the last 75 years products (both durable goods and software) were built via Waterfall development. This process forced companies to release and launch products by model years, and market new and “improved” versions.

In the last few years Agile and “Continuous Deployment” has replaced Waterfall and transformed how companies big and small build products. Agile is a tremendous advance in reducing time, money and wasted product development effort – and in having products better match customer needs.

But businesses are finding that Continuous Deployment not only changes engineering but has ripple effects on the rest of its business model. And these changes may have unintended consequences leading to customer dissatisfaction and confusion.

Smart companies will figure out how to educate their customers and communicate these changes.

—-

The Old Days – Waterfall Product Development
(skip this part of you’re conversant in Waterfall and Lean.)

Waterfall

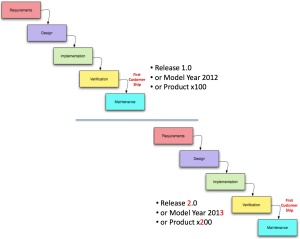
In the past both hardware and software were engineered using Waterfall development, a process that moves through new product development one-step-at-a-time.

  • Marketing delivers a “requirements” document to engineering.
  • Then engineering develops a functional specification and designs the product.
  • Next comes the work of actually building the product – implementation.
  • Then validation ensures the product was built to spec.
  • After the product ships, it’s maintained by fixing flaws/bugs.

Customers would get their hands on a product only after it had gone through a lengthy cycle that could take years – enterprise software 1-2 years, new microprocessors 2-4 years, automobiles 3-5 years, aircraft a decade.

Waterfall – The Customer View
When customers purchased a product they understood that they were buying this year’s model.  When next year’s model arrived, they did not expect that  the Ford station wagon or Maytag washer they purchased last year would be updated to match all the features in the new model. (Software at times had an upgrade path, often it required a new purchase.)

Waterfall allowed marketers to sell incremental upgrades to products as new models. First starting in the fashion business, then adopted by General Motors in the 1920’s annual model year changeovers turned into national events. (The same strategy would be embraced 75 years later by Microsoft for Windows and then Apple for the iPhone.)

As the press speculated about new features, companies added to the mystique by guarding the new designs with military secrecy. Consumers counted the days until the new models were “unveiled”.

With its punctuated and delineated release cycles, waterfall development led consumers to understand the limited rights they had to future product upgrades and enhancements (typically none.) In other words, consumer expectations were bounded.

Waterfall Releases

At the same time, manufacturers used new model changeovers to generate excitement over new features/versions convincing consumers to obsolete perfectly functional products and buy new ones.

Agile Development: Continuous Delivery and Deployment
In contrast to Waterfall development, Agile Development delivers incremental and iterative changes on an ongoing basis.

Agile Dev

Agile development has upended the familiar consumer expectations and company revenue models designed around the release cycles of Waterfall engineering. In a startup this enables deployment of Minimum Viable products at a rapid pace. For companies already in production, Continuous Deployment can eliminate months or years in between major releases or models. Companies can deliver product improvements via the cloud so that all customers get a better product over time.

While continuous delivery is truly a better development process for engineering, it has profound impacts on a company’s business model and customer expectations.

Continuous Delivery/Deployment – The Marketers View
Cloud based products has offered companies an opportunity to rethink how new business models would work. Adobe and Tesla offer two examples.

Tesla
While most of the literature talks about continuous Delivery/Deployment as a software innovation for web/mobile/cloud apps, Tesla is using it for durable goods – $100,000 cars – in both hardware and software.

Tesla Model S on the road

First, Tesla’s Model S sedan downloads firmware updates on a regular basis. These software changes go much further than simply changing user interface elements on the dashboard. Instead, they may modify major elements of the car from its suspension to its acceleration and handling characteristics.

Secondly, in a break from traditional automobile practices, rather than waiting a year to roll out annual improvements to its Model S, Tesla has been continuously improving its product each quarter on the assembly line.  There are no model years to differentiate a Tesla Model S built in 2012 from one built this year. (The last time this happened in auto manufacturing was the Ford Model T.)

Adobe
Adobe, which for decades sold newer versions of its products – Photoshop, Illustrator, etc. – has now moved all those products to the cloud and labeled them the Adobe Creative Cloud. Instead of paying for new products, customers now buy an annual subscription.

Photoshop package

The move to the cloud allowed Adobe to implement continuous delivery and deployment. But more importantly the change from a product sale into a subscription turned their revenue model into a predictable annuity. From an accounting/Wall Street perspective it was a seemingly smart move.

Continuous Delivery/Deployment – The Customer View
But this shift had some surprises for consumers, not all of them good.

As many companies are discovering, incremental improvement doesn’t have the same cachet to a consumer as new and better. While it may seem irrational, inefficient and illogical, the reality is that people like shiny new toys. They want newer things. Often. And they want to be the ones who own them, control them and decide when they want to change them.

Adobe
While creating a predictable revenue stream from high-end users, Adobe has created two problems. First, not all Adobe customers believe that Adobe’s new subscription business model is an improvement for them. If customers stop paying their monthly subscription they don’t just lose access to the Adobe Creative Suite software (Photoshop, Illustrator, etc.) used to create their work, they may lose access to the work they created.

Second, they unintentionally overshot the needs of students, small business and casual users, driving them to “good-enough” replacements like Pixelmator, Acorn, GIMP for PhotoShop and Sketch, iDraw, and ArtBoard for Illustrator.

The consequence of discarding low margin customers and optimizing revenue and margin in the short-term, Adobe risks enabling future competitors. In fact, this revenue model feels awfully close to the strategy of the U.S. integrated steel business when they abandoned their low margin business ot the mini-mills.

Tesla
What could go wrong with making a car incrementally better over time? First, Tesla’s unilateral elimination of features already paid for without consumers consent is a troubling precedent for cloud connected durable goods.

Second, Telsa’s elimination of model years and its aggressive marketing of the benefits of continuous development of hardware and software have set its current customers expectations unreasonably high. Some feel entitled to every new hardware feature rolled into manufacturing, even if the feature (i.e. faster charging, new parking sensors,) was not available when they bought their cars – and even if their car isn’t backwards compatible.

Model years gave consumers an explicit bound of what to expect. This lack of boundaries results in some customer disappointment.

Lessons Learned

  • Continuous Delivery/Deployment is a major engineering advance
  • It enables new business models
  • Customers don’t care about your business model, just it’s effect on them
  • While irrational, inefficient and illogical, people like shiny new toys
  • Subscription revenue models versus new purchases require consumer education
  • If your subscription revenue model “fires” a portion of your customers, it may enable new competitors
  • Companies need to clearly communicate customer entitlements to future features

Filed under: Customer Development, Marketing, Tesla
Read the whole story
joshuacollinsworth
3755 days ago
reply
Tullahoma, TN
Share this story
Delete

Are Economic Values Transmitted from Parents to Children?

1 Share
Marco Cipriani, Paola Giuliano, and Olivier Jeanne

Economic research shows that differences in cultural traits and values—for example, trust, or the propensity to cooperate and not free-ride on others—are important determinants of economic outcomes, such as growth, economic and financial development, and international trade. It’s much less clear, however, where these differences in economic-relevant values come from. While economists generally assume that they’re transmitted from parents to children, the empirical evidence to this effect is almost nonexistent.

     In a recently published paper, we tried to fill this gap by studying whether economic-relevant attitudes of children resemble those of their parents. We focus on what we call “pro-sociality,” that is, the importance attached to contributing to a common good. In the study, a sample of children and their parents play a public goods game—a standard way of measuring a person’s level of “pro-social” behavior. We then compare the pro-sociality of the children with that of their parents to see if they are related.

The Public Goods Game
In a public goods game, a subject is assigned to a group of, for instance, four people. Each person in the group is given some money, let’s say $1, and asked to share it between him or herself and a group fund. Contributions to the group fund are multiplied by two and divided equally between members of the group independently of how much they contributed to the group fund.

     Of course, if all members of the group keep their endowments for themselves, they each get to keep their $1. In contrast, since contributions to the group fund are doubled, if each member of the group contributes his or her endowment to the fund, each member ends up with $2, which is a clearly superior outcome. Nevertheless, an individual’s choice of how to behave in a public goods game is not a simple one. Let’s say that you’re playing the game and all the people in your group contribute their $1 endowment. If you do the same, everyone ends up with $2. If, however, you decide not to contribute, you keep your $1 and still receive $1.50 from the group fund, leaving you with a total of $2.50. For you as an individual, not contributing to the fund is better than contributing.

     In other words, in a public goods game there’s a tension between what’s good for the group and what’s good for the individual. Although it’s better for the group as a whole that everyone contributes his or her own endowment, each member of the group individually has an incentive to keep the endowment and free-ride on the others. This problem is very similar to the decision of fixing the roof in an apartment building: everyone enjoys the new roof, including those who didn’t contribute to it; as a result, everyone has an incentive not to pay for the roof repairs and let the neighbors fix it.

     Public goods games have been studied extensively by economists. They find that individuals usually contribute between 40 and 60 percent of the maximum amount ($1 in our example), depending on how the game is implemented. Because contributing has a positive effect on the group as a whole, an individual’s contribution can be taken as an indicator of his or her pro-sociality.

     The behavior of both children and parents in the new study was similar to that found in previous work: parents contributed 58 percent of the maximum amount, and children contributed just slightly less, at 55 percent. However, was the behavior of the children similar to that of their parents? In other words, was there evidence from how the game was played that pro-sociality is transmitted from parents to children?

Like Mother Like Son?
The answer is no. The data don’t show any correlation between a parent’s contribution and that of his or her child. In other words, there’s no evidence that pro-social behavior is transmitted from parents to children. This finding is robust to several specifications that we used to analyze the data.

     Of course, many caveats are in order. It’s possible that abstract games like the one we used aren’t the best way of capturing people’s attitudes toward contributing to a public good. The sample we studied (children in a Washington, D.C., public school and their parents) may not be representative, and different results may be obtained when looking at different segments of the population. Partial understanding of the game by young children may have also confounded the results.

     Nevertheless, the absence of transmission of economic-relevant values from parents to children is very surprising. An unchallenged assumption in the economic literature on values and economic outcomes is the idea that the family has an important role in transmitting these values across generations. Our results provide an important piece of evidence to the contrary, which calls for further work on the issue.


Disclaimer
The views expressed in this post are those of the authors and do not necessarily reflect the position of the Federal Reserve Bank of New York or the Federal Reserve System. Any errors or omissions are the responsibility of the authors.


Cipriani_marco
Marco Cipriani is a senior economist in the Federal Reserve Bank of New York’s Research and Statistics Group.


Paola Giuliano is a professor of economics at the University of California, Los Angeles.


Olivier Jeanne is a professor of economics at Johns Hopkins University.


Read the whole story
joshuacollinsworth
3756 days ago
reply
Tullahoma, TN
Share this story
Delete

All quiet on the southern front

1 Share

After a wild ride in 2011-2012, interest rates have settled down on European sovereign debt. For now.


Yields on long-term government bonds, Jan 2009 to Nov 2013. Data source: Eurostat.
sov_yields_dec13.png

Greek yields fell sharply following the PSI agreement in March 2012, a de facto default that ended up reducing the value of Greek's debt by 20%. But as a result of ongoing deficits and plunging GDP, the ratio of debt to GDP for Greece is now almost back up to where it was in at the end of 2011. In the mean time, debt/GDP has continued its uninterrupted climb for Portugal, Ireland, Italy, and Spain.


General government debt as a percent of GDP, 2000:Q1-2013:Q2. Data source: Eurostat.
sov_debt_dec13.png

On the other hand, these countries have seen sharp improvements in their current account, having gone in a very short period from large deficits to outright surpluses. Unfortunately, this seems not so much due to currency depreciation or wage and price adjustments restoring competitiveness as it has to the collapse in aggregate spending (on both home and foreign goods) associated with the sharp economic downturns in these countries.


Historical and projected current account surplus as a percent of GDP, annual, 2000-2013. Data source: IMF.
sov_ca_dec13.png

Still, the improved current accounts mean less borrowing from abroad and reduced vulnerability to shifting moods of international credit markets. My recent paper with Greenlaw, Hooper, and Mishkin (and much previous research before us) identified the debt-to-GDP ratio and current-account deficits as two key factors that influence a country's vulnerability to sudden spikes in borrowing cost. One distinctive feature we found in the data was a strong nonlinear interaction between the current-account deficit and debt loads. Our paper used a 5-year average of the current-account/GDP ratio as the variable that interacts with the current debt load to predict the interest rate on a country's long-term sovereign debt. I was curious to see what our estimates would imply if we assumed that the recent improvements in the current account turn out to be permanent.

The table below summarizes how debt, the current-account surplus, and interest rate on government debt have changed since 2012 for these 5 European countries. The final column gives the amount by which the 10-year yield on government debt would be predicted to fall if debt/GDP changed by the amount indicated in columns (2) and (3) and the change in the current-account surplus given in columns (4) and (5) is assumed to be permanent. Much of the observed drop in yields could be explained by the elimination of big current-account deficits.


Debt as a percent of GDP in 2011 and 2013:Q2, current-account surplus as a percent of GDP over 2007-2011 and projected for 2013, interest rate on 10-year sovereign bonds in 2012 and November 2013, actual change in yields, and predicted change in yields based on equation (18) in Greenlaw, Hamilton, Hooper, and Mishkin (2013).
debt/GDPcurrent-account/GDPinterest rateactualpredicted
20112013:Q22007-20112013 (proj)2012Nov 2013changechange
(1)(2)(3)(4)(5)(6)(7)(8)
Greece170.6169.1-12.1-0.3 22.98.214.711.2
Portugal108.0131.4-10.20.1 11.06.05.04.2
Ireland106.5125.7-2.23.4 6.03.52.51.8
Spain69.192.3-6.51.1 5.94.11.81.1
Italy120.8133.3-2.50.3 5.54.11.40.9

An improving current-account balance means less borrowing from abroad. So who is funding the growing sovereign debt? The answer appears to be domestic banks. The Telegraph's Ambrose Evans-Pritchard leads us to page 33 of this report from the German central bank which reports that Spanish monetary financial institutions increased their holdings of Spanish government debt by € 134 billion between November 2011 and September 2013. That's an 81% increase and accounts for 65% of the total increase in Spanish sovereign debt over the period. Italian banks increased their holdings by € 175 billion, a 73% increase which accounts for more than 100% of the increase in Italian sovereign debt.


Sovereign debt held by domestic monetary financial institutions. Source: Bundesbank.
sov_banks_dec13.png

And where did the banks get the funds to lend to the government? From the ECB, whose outstanding loans to Spanish and Italian banks come close to half a trillion euros.


Outstanding ECB LTRO loans to institutions from selected countries in billions of euros. Source: BNP Paribus.
sov_ltro_dec13.png

This is a fine deal for the banks, borrowing from the ECB at a lower rate than they can earn on the sovereign debt. But it does not change the underlying reality. Greece's debt load of 170% of GDP and interest rate in excess of 8% means that its taxpayers must surrender 14% of the country's total income every year just to make interest payments on the debt. Portugal needs to sacrifice 8% every year. Neither is going to happen; further defaults seem unavoidable.

But if the ECB does not keep renewing the LTRO loans, rates would spike back up and we'd replay last year's excitement in financial markets.

This can will be kicked down the road.

Read the whole story
joshuacollinsworth
3764 days ago
reply
Tullahoma, TN
Share this story
Delete

U.S. tight oil production surging

1 Share

The U.S. Energy Information Administration last week issued an early release of its Annual Energy Outlook 2014, which shows substantially more optimism about near-term U.S. crude oil production compared to the AEO 2013 assessment completed just eight months ago.

In its April report the EIA was anticipating that U.S. production of crude oil from the tight formations now made accessible with fracking drilling methods would total 2.3 million barrels per day for 2013, and could increase another half-million barrels per day above that before peaking in 2020. But the new assessment is that 2013 tight oil production will amount to 3.5 mb/d-- over a million barrels more than the earlier estimate-- and will gain another 1.3 mb/d beyond that before peaking in 2021.


EIA's historical estimates and projected future total U.S. tight oil production in millions of barrels per day as of April 2013 and December 2013
YearApril estimatesDec estimates
2008 0.54 0.61
2009 0.63 0.69
2010 0.82 0.87
2011 1.22 1.31
2012 2.00 2.25
2013 2.30 3.48
2014 2.51 4.07
2015 2.63 4.49
2016 2.71 4.67
2017 2.75 4.72
2018 2.76 4.76
2019 2.78 4.78
2020 2.81 4.79
2021 2.80 4.80
2022 2.74 4.74
2023 2.69 4.68
2024 2.67 4.61
2025 2.63 4.54
2026 2.52 4.47
2027 2.44 4.42
2028 2.39 4.34
2029 2.29 4.26
2030 2.19 4.17

Those numbers along with the EIA's other projections imply that total U.S. field production of crude oil from all sources would reach 9.6 mb/d in 2019-- almost as high as the all-time U.S. peak in 1970-- before resuming its decline. If you add in natural gas liquids (which you really shouldn't) and ethanol produced from corn (which is even less useful [1], [2]), the total would substantially exceed the historical U.S. peak.


Source: AEO 2014.
oil_proj_dec_13.png

Interestingly, any reductions in crude oil prices associated with this increased production are expected by the EIA to be relatively modest and short lived.


Average annual spot price of Brent in 2012 dollars per barrel. Source: AEO 2014.
oil_price_proj_dec_13.png

Why wouldn't all this new production have a more dramatic effect on the price of oil? The answer is that, had it not been for the increase in tight oil production in the U.S. and oil sands from Canada, global oil production would actually have declined between 2005 and 2012. And the growth in oil consumption from the emerging economies has eaten up more than all of this new production.

Read the whole story
joshuacollinsworth
3770 days ago
reply
Tullahoma, TN
Share this story
Delete

I Don't Own a TV

6 Comments and 16 Shares
Theory: Smugness is proportional to the negative second derivative of TV ownership rate with respect to time.
Read the whole story
joshuacollinsworth
3789 days ago
reply
truth
Tullahoma, TN
Share this story
Delete
5 public comments
Dadster
3789 days ago
reply
Not sure if the smugness might be over-represented, but there's no z-measurement for "what's a tv?" so I could be wrong there.
New Hampshire
ktgeek
3789 days ago
reply
Once again xkcd shares truth. But I am a TV junkie...
Bartlett, IL
emdeesee
3789 days ago
reply
Come on. We say, "I don't have cable" or "No, I haven't seen the commercial with the wombat" now.
Sherman, TX
initio
3790 days ago
reply
I do.
Canberra
colaco
3790 days ago
reply
Alt-text: "Theory: Smugness is proportional to the negative second derivative of TV ownership rate with respect to time."
Amora, Setubal, Portugal